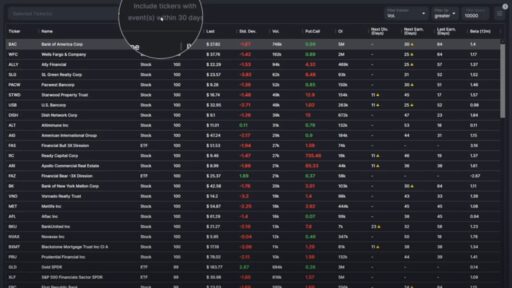
Hello, traders! Today, we’re diving into the crucial metrics on the right-hand side of our trading screens, focusing on how these numbers can enhance your trading strategies. We’ll dissect each metric, explain what it means, and how it impacts your trades. For illustration, we’ll use an example involving a bear call spread on SPY.
Setting Up the Trade
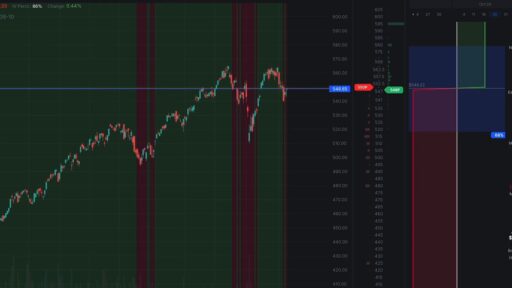
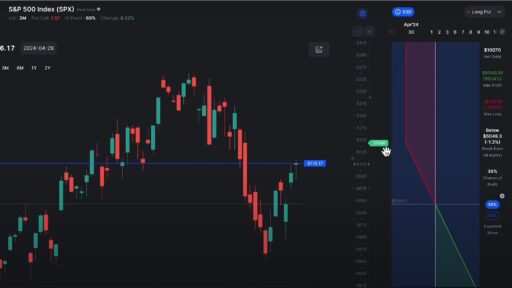
Let’s start with our trade setup. We’re using SPY and have created a bear call spread with the following parameters:
- Expiration Date: May 31 (30 days out)
- Strike Prices: Sell 520 Call, Buy 525 Call
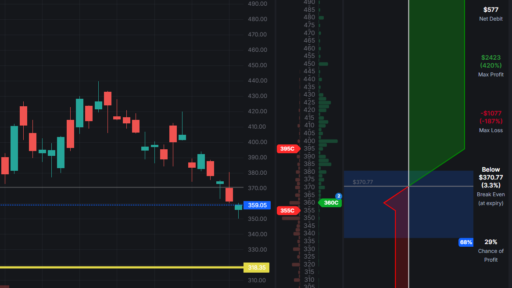
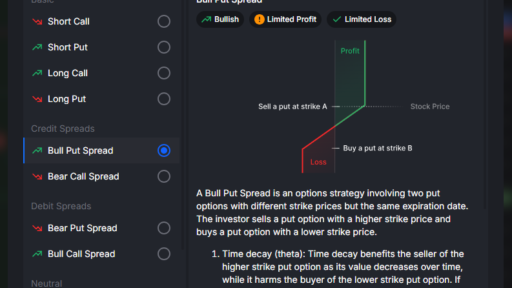
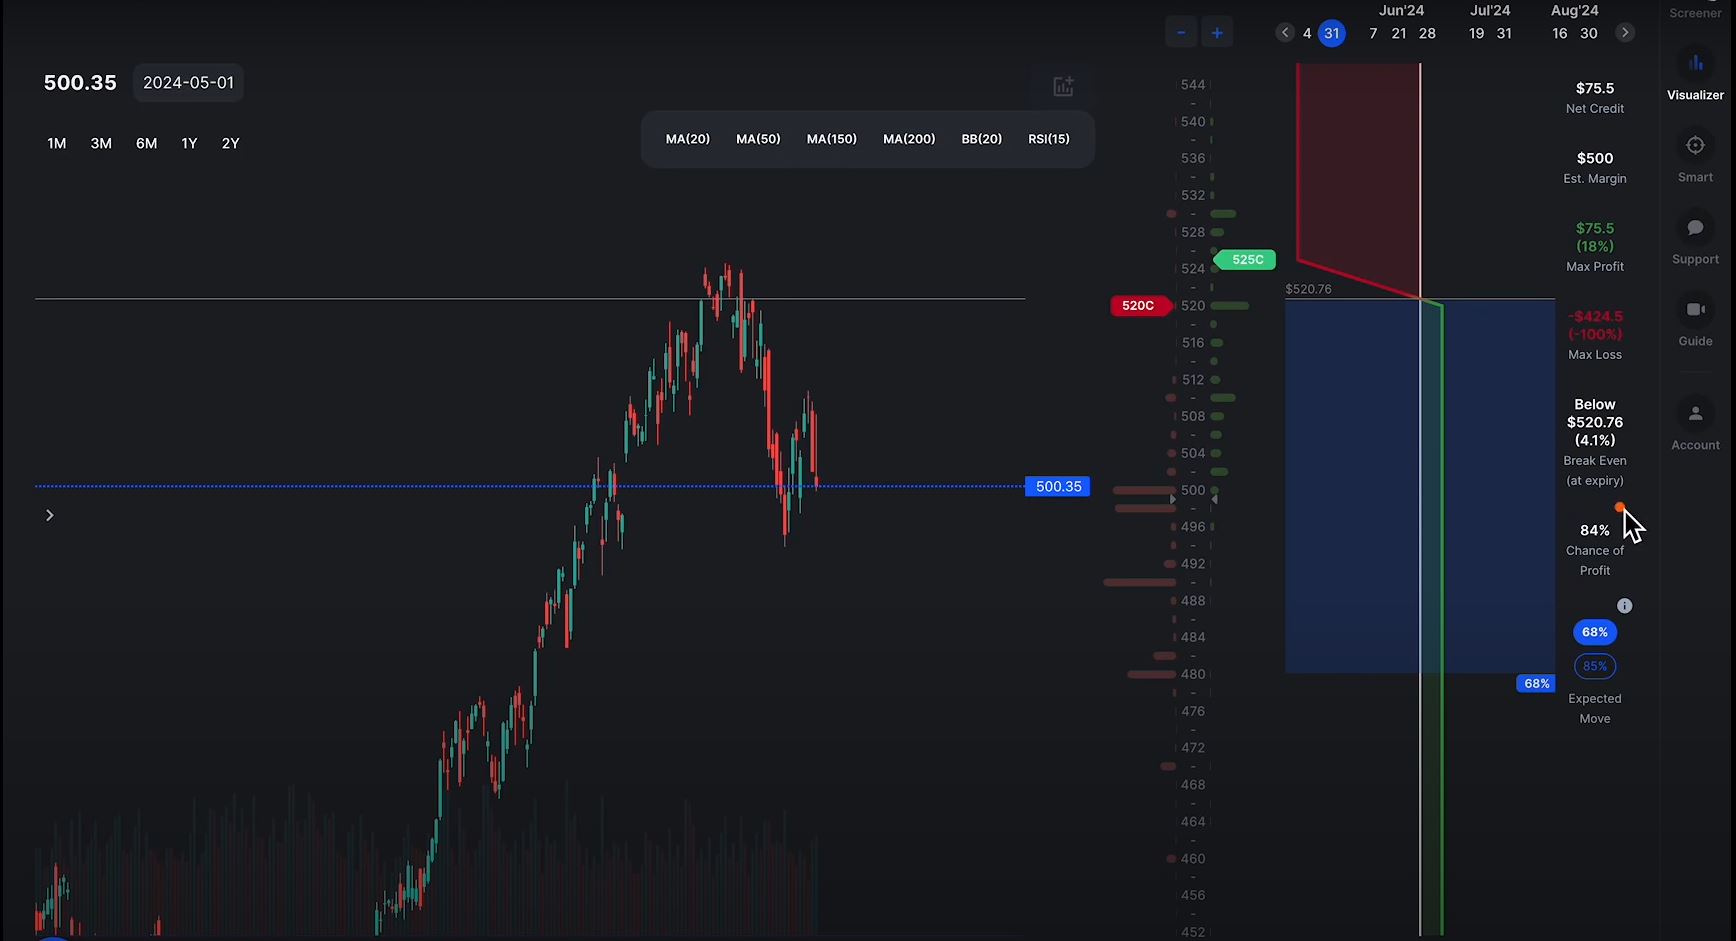
This setup involves selling a 520 call and buying a 525 call, which establishes a credit spread. Here’s how we interpret the key metrics for this trade:
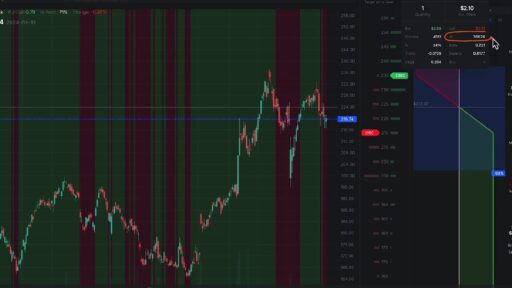
1. Net Credit
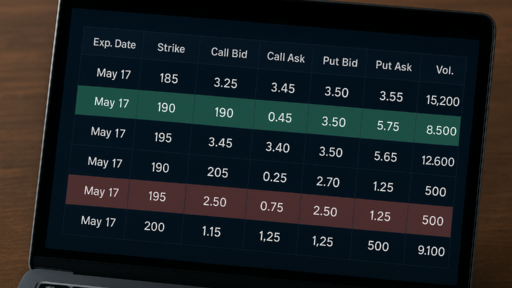
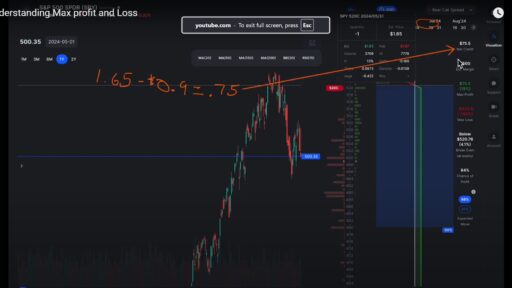
The net credit is the amount we receive from initiating the trade. For our bear call spread:
- Sell 520 Call: $1.65
- Buy 525 Call: $0.90
Net Credit Calculation: 1.65−0.90=0.751.65 – 0.90 = 0.751.65−0.90=0.75 Thus, the net credit is $75.50 (since each option contract represents 100 shares).
2. Estimated Margin
The estimated margin is the collateral required for this trade, based on the width of the spread. For our current setup with a 5-point spread (525 – 520):
- Margin Required: $5 x 100 shares = $500
If we adjusted the spread to 5.30 (i.e., changing the upper strike to 530), the margin would increase to $1,000. The margin reflects the maximum potential loss if the trade goes against you.
3. Maximum Profit
Maximum profit occurs if the underlying stock stays below the lower strike price at expiration. For our trade:
- Maximum Profit: $75.50
This is equal to the net credit received, assuming SPY is below $520 at expiration.
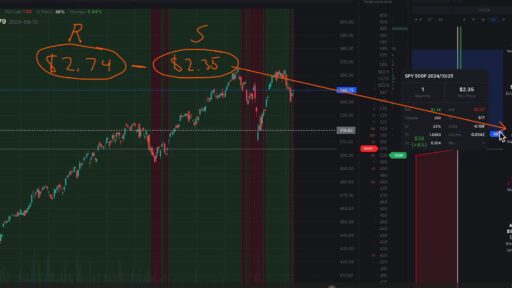
4. Maximum Loss
Maximum loss is calculated by taking the width of the spread and subtracting the net credit received. For our 5-point spread:
- Width of Spread: $5
- Net Credit Received: $0.75
Maximum Loss Calculation: 5−0.75=4.255 – 0.75 = 4.255−0.75=4.25 4.25 x 100 = $425
So, the maximum loss is $425.
5. Break-Even Point
The break-even point is where the trade neither gains nor loses money at expiration. For our trade:
- Break-Even Calculation: 520+0.75=520.75520 + 0.75 = 520.75520+0.75=520.75
Thus, the break-even price is $520.75. If SPY is above this price at expiration, the trade will incur a loss.
6. Chance of Profit
The chance of profit is an estimate of the probability that the trade will be profitable at expiration. For our spread:
- Delta of Short Leg: -0.16
To estimate the chance of profit: 100%−Delta=100%−16%=84%100\% – \text{Delta} = 100\% – 16\% = 84\%100%−Delta=100%−16%=84%
This gives us an approximate 84% chance of the trade being profitable.
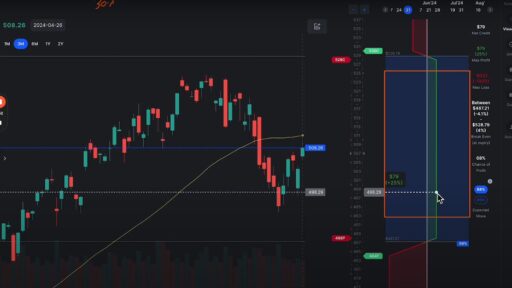
7. Expected Move
The expected move represents the range within which the underlying asset is likely to trade, based on standard deviation. For SPY between now and May 31:
- 68% Expected Move Range: Between $480 and $520
This is derived from statistical probabilities, helping you understand potential price ranges for SPY.
Conclusion
Understanding these metrics is crucial for managing your trades effectively. By grasping how net credit, margin, maximum profit, maximum loss, break-even points, chances of profit, and expected moves interact, you can make more informed decisions and better manage risk in your trading strategy.