
When you dive into stock data analysis with ANI, you might find yourself looking at a variety of data points for a specific stock. Let’s take a closer look at what these data points mean using Starbucks as an example. Understanding these metrics can provide valuable insights into a stock’s performance and help guide your investment decisions.
Key Data Points Unpacked
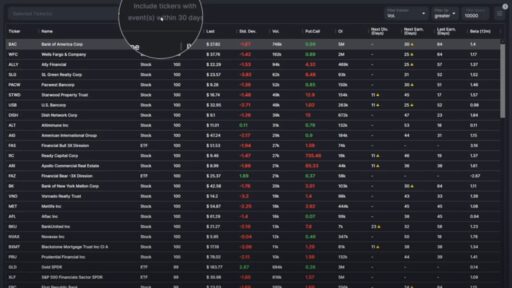
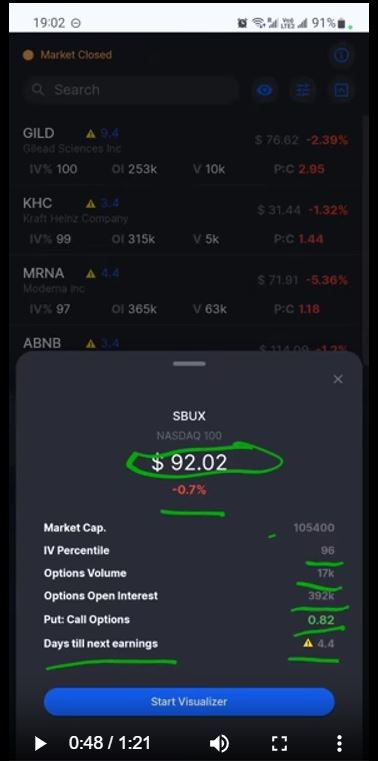
- Market Cap: This metric reflects the total market value of Starbucks’ outstanding shares. It helps gauge the company’s size and stability. By tapping on the market cap data point, you get a clear view of how Starbucks stacks up against other companies.
- Implied Volatility (IV) Percentile: Implied volatility shows how much the stock’s price is expected to move compared to its usual volatility. This percentile ranks Starbucks’ volatility relative to its historical range. A high percentile indicates greater expected movement, which can be crucial for options trading.
- Options Volume: This figure represents the total number of options contracts traded for Starbucks over the last trading day. It gives you an idea of how actively options are being traded, which can indicate market sentiment and potential price movements.
- Open Interest: This measures the total number of outstanding options contracts for Starbucks across all expiration dates and strike prices. High open interest can signal strong investor interest and liquidity.
- Put/Call Ratio: This ratio compares the number of put options (bets that the stock price will fall) to call options (bets that the stock price will rise). A higher ratio may suggest bearish sentiment, while a lower ratio can indicate bullish sentiment.
- Days Until Next Earnings: Knowing how many days are left until Starbucks’ next earnings report is vital for anticipating potential price movements and volatility. Earnings reports can significantly impact stock prices, so this data point helps you plan your trades accordingly.
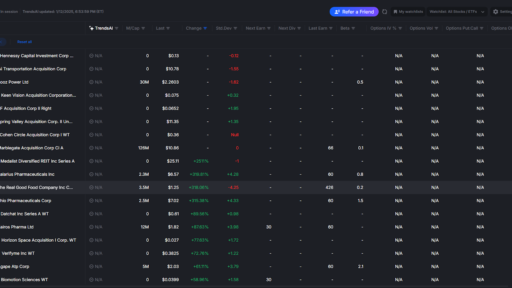
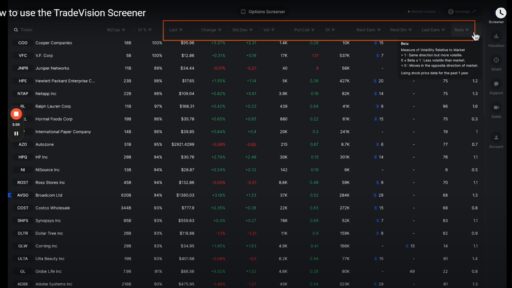
Navigating the Screener
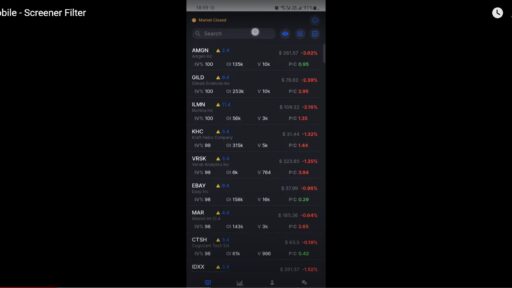
When you use the screener, all these data points are presented in a user-friendly format. For example, when you look at Qualcomm in the screener, you can quickly see:
- Days Until Earnings: Qualcomm’s earnings report is in 3.4 days.
- Stock Movement: The stock has moved by 5% recently.
- Options Volume and Open Interest: These metrics provide insights into recent trading activity.
- Put/Call Ratio: Gives you a sense of market sentiment.
- Share Price Movement: Indicates how the stock price has changed today or in the most recent trading session.
By tapping on each data point, you can get a more detailed explanation and better understand how each metric affects Starbucks’ stock performance.
Conclusion
With ANI, exploring stock data is straightforward and informative. By examining metrics like market cap, implied volatility, options volume, open interest, the put/call ratio, and days until earnings, you gain a comprehensive view of a stock’s behavior. This detailed understanding helps you make more informed investment decisions, whether you’re trading options or investing long-term.
By familiarizing yourself with these key data points and how to interpret them, you’ll be better equipped to navigate the stock market and make strategic investment choices.