
Navigating the stock market can be a daunting task, but with the right tools, it becomes much more manageable. Today, we’re diving into a comprehensive screener to help you better understand how to evaluate stocks using different columns and filters. Whether you’re a seasoned investor or just starting out, this guide will help you make the most out of your stock screening experience.
Getting Started with Your Watch Lists
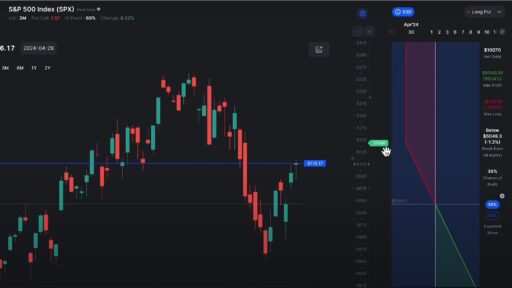
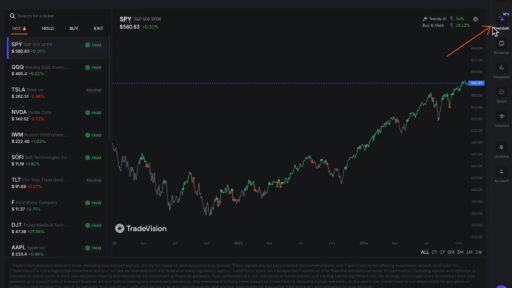
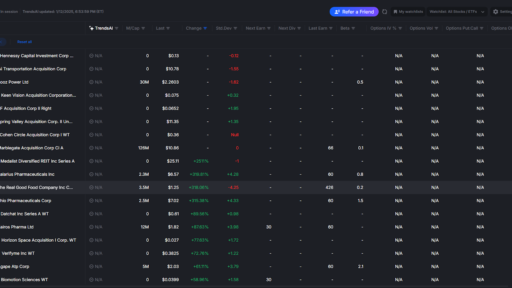
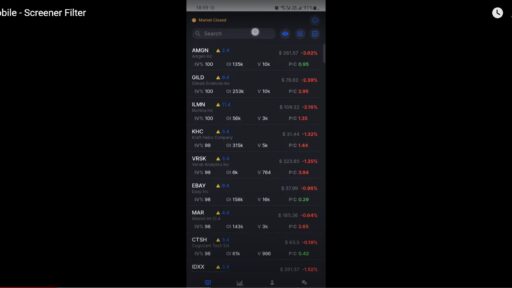
When you first open the screener, you’ll see the option to select from various watch lists. For our purposes today, we’ll focus on the S&P 500 index. This is a great starting point as it includes 500 of the largest publicly traded companies in the U.S. You also have the option to look at the Nasdaq 100, all stocks, ETFs, or even a custom watch list you’ve created.
Once you’ve selected your watch list, you can start analyzing the stocks within it. The screener provides various columns that offer valuable information about each stock.
Understanding Key Columns
Here’s a breakdown of some important columns and how you can use them to sort and filter stocks:
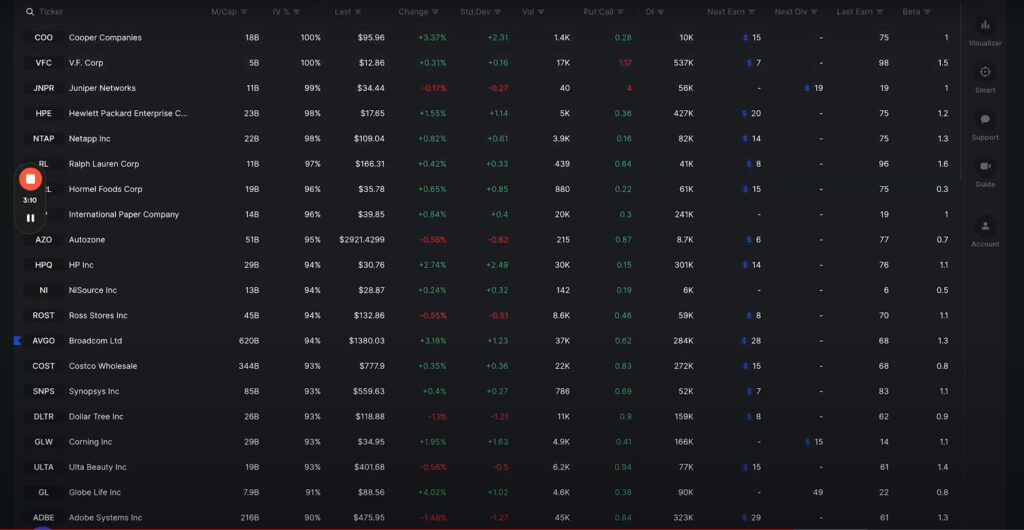
- Market Capitalization (Market Cap): This column shows the total dollar value of a company’s outstanding shares. It’s a crucial metric for understanding the size of a company. To see which companies have the largest market cap, you can sort this column in descending order. For example, Microsoft, Apple, and Nvidia typically top the list.
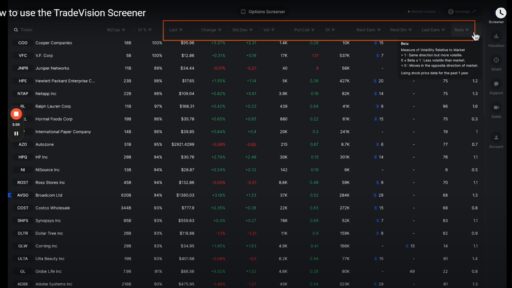
- Implied Volatility Percentile: This metric gives you an idea of how volatile a stock is expected to be. A higher percentile indicates higher expected volatility. You can sort this column to view stocks with the highest or lowest implied volatility. If you want to filter stocks with high implied volatility, set a filter to show only those with a percentile greater than or equal to 50%.
Filtering and Sorting
To get a more focused view of the stocks, you can apply various filters:
- Market Capitalization Filter: To find the largest companies, sort the market cap column in descending order. This helps you quickly identify major players in the index.
- Implied Volatility Filter: If you’re interested in stocks with high expected price swings, you can filter to show only those with high implied volatility. For instance, filtering for stocks with an implied volatility percentile of 50% or above can help you find high-risk, high-reward opportunities.
Advanced Filters: Earnings and More
The screener also allows you to refine your results based on upcoming earnings:
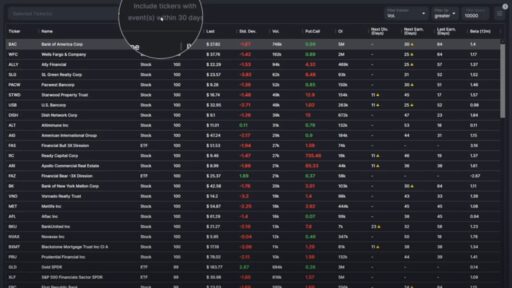
- Earnings in the Next 30 Days: You can choose to include or exclude stocks based on whether they have earnings reports scheduled within the next 30 days. This is particularly useful if you want to avoid the volatility associated with earnings announcements or if you want to focus specifically on stocks with upcoming earnings.
For example, if you exclude stocks with earnings in the next 30 days, you might see that some high-implied volatility stocks, like Cooper Companies, are not included because they have an earnings report coming up soon. On the other hand, Juniper Networks might appear as it has high implied volatility but no earnings scheduled in the near term.
Resetting and Customizing Your View
If you need to start fresh, you can reset all filters with a single click. This is helpful if you want to change your criteria or just get a clean slate. You can also remove individual filters by clicking the ‘x’ next to each one.
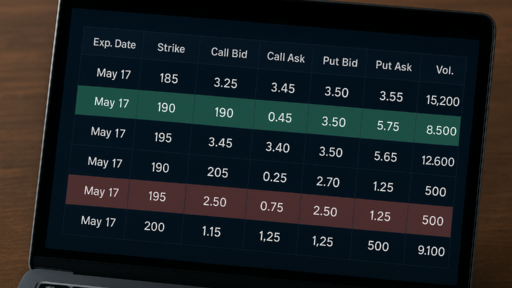
Additionally, the screener offers various columns for further analysis, such as the last price change, percentage change, standard deviation, options volume, put-to-call ratio, and open interest. Each of these metrics provides different insights into a stock’s performance and market behavior.
Conclusion
Using a screener effectively can greatly enhance your ability to analyze and select stocks. By understanding how to use and interpret different columns and filters, you can tailor your stock analysis to match your trading strategy. Whether you’re looking for high-cap giants, volatile stocks, or those with upcoming earnings, the screener’s tools help you make informed decisions.