Predicting bull or bear markets is vital for investors. Bull markets feature rising prices and higher averages, indicating confidence, while bear markets show falling prices and pessimism. No matter if you are investing in stocks or trading options, being able to get a directional sense of which way the stock is heading would impact the types of trade you would want to place.
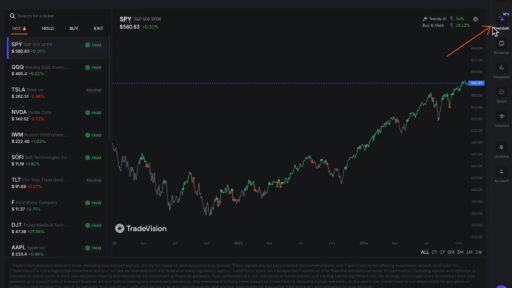
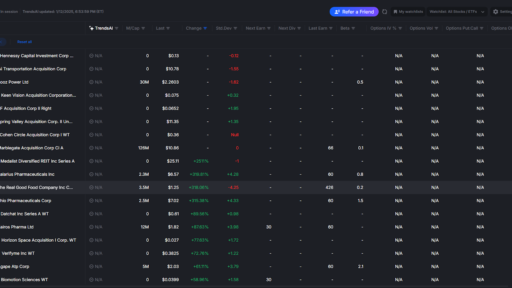
To tackle this problem of predicting bull or bear state for any given stock, we have developed TrendsAI.
TrendsAI is offered at tradevision.io and you can sign up at tradevision.io/sign-up.
A0
Release date: 09/10/2024 (After Market Close)Key Changes:
- V3 is still available and can be accessed
- Model A0 improves on version V3 by directly optimizing the returns or Sharpe ratio of the trading strategy, instead of predicting uptrends / downtrends.
We use several indicators, including but not limited to:
- TrendMeter Indicator: This looks at EMA (Exponential Moving Average) crossovers for three periods. If the most recent EMA is above the short, medium, and long-term EMAs, it’s considered one of the buy signals.
- SuperTrend Indicator: It generates buy signal using a multiple of the Average True Range (ATR) over time.
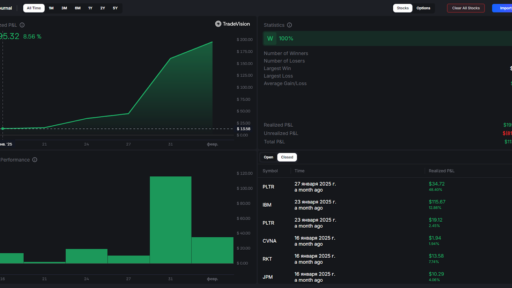
We optimize the parameters for these indicators using Walk Forward Optimization (WFO). This means we tune the parameters on historical data (e.g., 2015-2021) and then test them on a later period (2022-present) to improve reliability. Model A1 includes backtested results and in general performs better than the Buy & Hold strategy.
V3.0
Release date: 07/26/2024 (After Market Close)Key Changes:
- All the previous predictions from V2 will be updated from predictions from the V3 model
- In this new model, we have defined a bull market as the price in the future 30 trading days being higher than the price in the previous 30 days
There is not a fixed definition for a bullish market – the stock price is just ** consistently ** higher than a bear market. By having an exact definition of a bull market, we can build an AI model to learn the importance (weight) of each technical indicator that would best predict if our definition of bull market. The current list of technical indicators we are using are:
- Percent change from last close
- Percent change from MA 7 close
- Percent change from MA 14 close
- MACD
- EMA Crossover
Our results has shown that the model is significantly better than just using the technical indicators alone without the model. We will be releasing this version for a sample of 489 tickers in the S&P 500 index and will be adding more tickers and update this section as we do that.
V2.0
Release date: 07/17/2024Here we took a different approach and let a machine learning algorithm (Hidden Markov Model) learn what a bull or bear market is based on historical returns. We then backtested our prediction by benchmarking against a few other common trading strategies (Buy & Hold, CrossOver etc). The backtesting results are positive and sometimes beating the Buy & Hold strategy.
Potential improvements:
While the results are positive, the results are not always repeatable across a large number of tickers. That prevents us from offering this for most of the tickers. Also since this approach is not based on technical indicators and the way the model learns from the data can be opaque, it requires constant monitoring to make sure the results are consistently good in the future
V1.0
Release date: 06/01/2024On each trading day, we compute 10 different technical indicators based on various short & long term trends. Based on that we derive a score from 1 to 10 depending on how many of the indicators are active. A higher score indicates the stock is more likely to be in a bullish trend and vice versa. Description of the 10 indicators are shown below.
Potential improvements:
This method can be refined by assigning appropriate importance to each indicator based on historical results
Band 10: Breakout/Breakdown – Identifies bullish or bearish breakouts based on recent highs and lows.
Band 9: Price vs. Moving Average – Compares today’s average price to the 23-period EMA.
Band 8: Candle Color Dominance – Evaluates the prevalence of bullish or bearish candles over the past 15 days.
Band 7: EMA of Mean Price – Compares the EMA of the mean price to the previous day’s EMA.
Band 6: Mean Price vs. EMA – Assesses whether the mean price is above or below the 23-period EMA.
Band 5: Mansfield Relative Strength – Measures the stock’s performance relative to a benchmark.
Band 4: Short-term vs. Long-term MA – Uses the MACD Histogram to indicate momentum changes.
Band 3: Momentum Indicator – Analyzes bullish or bearish momentum using the MACD Histogram.
Band 2: Volume and Price Change – Sums volume differences to gauge market sentiment.
Band 1: RSI / Support and Resistance – Evaluates the RSI relative to overbought and oversold thresholds